

Modern LLM applications require more than basic application monitoring. As AI systems become part of customer support, enterprise search, coding assistants, document processing, and AI agents, teams need to understand what is happening across the entire AI workload.
AI Observability provides this visibility by connecting application behavior, model performance, infrastructure usage, latency, token consumption, and quality signals. Instead of discovering problems only after users report them, engineering teams can identify performance issues and understand their underlying causes.
For organizations operating production AI systems, observability is becoming an essential part of building reliable and cost-efficient infrastructure.
What Makes LLM Observability Different?
Traditional monitoring usually focuses on whether an application is available and responding correctly. Metrics such as CPU usage, memory consumption, HTTP errors, and response time are useful, but they do not provide enough information for LLM applications.
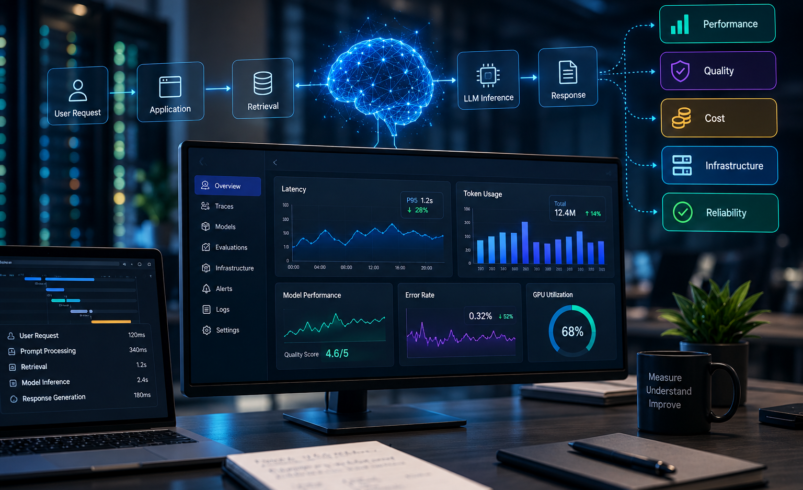
An LLM request can involve prompt processing, retrieval, model inference, token generation, databases, external APIs, GPUs, and multiple application services.
A response may therefore become slower even when the main application server appears healthy.
For example, an increase in response latency could be caused by longer prompts, increased concurrency, GPU memory pressure, retrieval delays, inefficient batching, or a model configuration change.
AI Observability helps teams connect these different signals and understand the complete request lifecycle.
Monitor Time to First Token
Time to First Token, commonly called TTFT, is an important metric for interactive LLM applications.
Users generally expect an AI application to begin responding quickly. Even if the final response takes some time to generate, a long delay before the first token can make the system feel slow.
TTFT can be affected by prompt processing, request queueing, model loading, GPU availability, retrieval operations, and infrastructure configuration.
Monitoring TTFT across production workloads allows teams to identify whether delays occur before token generation begins.
Looking at average TTFT alone may not be enough. Monitoring percentile measurements such as p95 and p99 can reveal slower requests that would otherwise remain hidden.
Track Inter-Token Latency
Once generation begins, another important measurement is the time between generated tokens.
Inter-token latency helps teams understand how quickly the model is producing output after the first token.
A workload may have excellent TTFT but still feel slow if tokens are generated slowly.
Monitoring both TTFT and inter-token latency creates a more complete picture of the user experience.
These measurements can also help determine whether performance problems originate from model inference, GPU constraints, batching behavior, or other parts of the serving architecture.
Monitor Token Usage and Cost
Tokens are closely connected to LLM performance and operating costs.
Longer prompts, larger context windows, and longer responses increase the amount of computation required by the workload.
If token consumption grows unexpectedly, infrastructure requirements and costs can increase as well.
AI Observability should therefore include input tokens, output tokens, total tokens, and token usage by application or workload.
This allows teams to identify applications that are consuming significantly more resources than expected.
For enterprise AI deployments, connecting token usage with infrastructure consumption can provide valuable information for capacity planning and cost optimization.
Monitor GPU Utilization and Memory
LLM performance is strongly influenced by GPU resources.
GPU utilization provides insight into whether available compute capacity is being effectively used. However, utilization alone does not tell the complete story.
GPU memory can become a limiting factor even when compute utilization does not appear unusually high.
Model weights, KV cache, context length, batching, and concurrent requests all affect memory requirements.
Monitoring GPU memory usage alongside workload behavior can help identify whether an application is approaching capacity limits.
When GPU memory becomes constrained, teams may experience slower inference, reduced concurrency, or the need for additional GPUs.
Understand Queue Depth and Concurrency
Production LLM applications rarely process one request at a time.
As concurrent users increase, requests may wait before being processed by the model-serving system.
Queue depth and request concurrency can therefore provide important information about performance bottlenecks.
A sudden increase in queue depth combined with high GPU utilization may indicate insufficient inference capacity.
On the other hand, high queue depth with relatively low GPU utilization could point toward scheduling, batching, or serving configuration problems.
AI Observability makes these relationships easier to investigate.
Monitor Model and Prompt Changes
LLM systems can change frequently.
Teams may switch models, modify system prompts, change retrieval strategies, introduce new tools, or adjust inference parameters.
These changes can affect performance even when the underlying application code remains unchanged.
For example, a prompt update could increase input token consumption and make responses slower. A model upgrade could improve quality but require additional GPU resources.
Tracking model versions and prompt versions alongside performance metrics helps teams determine whether a change introduced a regression.
This makes observability useful not only for operations but also for AI development and optimization.
Add Quality Monitoring to AI Observability
LLM systems can remain technically available while producing poor results.
A traditional uptime dashboard might show that every API request is succeeding even when the model is generating inaccurate or irrelevant responses.
This makes quality monitoring particularly important for AI applications.
Organizations can evaluate signals such as hallucination rates, response quality, retrieval accuracy, user feedback, and task-specific evaluation scores.
Combining these quality signals with infrastructure metrics creates a more complete understanding of AI system health.
For example, an increase in hallucinations could coincide with a retrieval pipeline change rather than a GPU problem.
Without AI-specific observability, identifying this relationship can be difficult.
Use Distributed Tracing
Modern AI applications often consist of multiple components.
A typical request may move through an API gateway, authentication service, retrieval system, vector database, model server, external tool, and application layer.
Distributed tracing helps engineers follow the request across these components.
Instead of seeing only the final response time, teams can determine how much time was spent retrieving information, waiting in queues, running inference, or communicating with external services.
This can significantly reduce troubleshooting time when an AI application becomes slow.
OpenTelemetry and similar tracing approaches can also help organizations standardize telemetry across different services and infrastructure environments.
Connect Observability With Infrastructure Decisions
Observability becomes more valuable when its insights influence infrastructure decisions.
Suppose monitoring shows that a workload consistently reaches GPU memory limits during periods of high concurrency. The organization can then evaluate whether it needs a different GPU configuration, improved batching, model quantization, or another serving strategy.
Similarly, if GPU utilization remains low for most of the day, the organization may be able to reconsider capacity planning.
This is where infratailors.ai can complement an observability strategy.
Rather than treating monitoring and infrastructure planning as separate activities, organizations can use workload and performance information to make more informed decisions about AI infrastructure.
Build AI Observability Before Production
One of the biggest mistakes organizations make is waiting until an AI application experiences a serious production incident before implementing observability.
By that point, there may be insufficient historical data to determine when performance started changing or which deployment introduced the problem.
Observability should be designed into the AI application from the beginning.
Teams should establish performance baselines during testing and continue collecting comparable metrics after production deployment.
This makes it easier to identify gradual changes in latency, token usage, GPU utilization, and quality.
Avoid Monitoring Too Much Without Context
Collecting large amounts of telemetry does not automatically create useful observability.
Teams can quickly become overwhelmed by dashboards and logs that provide information without explaining what action should be taken.
Effective AI Observability focuses on meaningful relationships between metrics.
For example, an increase in latency becomes much more useful when it can be correlated with GPU memory usage, queue depth, token consumption, model version, and request type.
The objective should be actionable visibility rather than simply collecting more data.
How infratailors.ai Supports Better AI Infrastructure Decisions
infratailors.ai focuses on AI infrastructure optimization and workload-aware infrastructure decisions.
For organizations operating LLM applications, observability data can provide valuable evidence about how workloads behave in production. That information can then support decisions around GPU selection, infrastructure sizing, deployment configuration, and performance optimization.
This creates a continuous improvement cycle.
Teams can measure the workload, identify bottlenecks, evaluate infrastructure options, deploy improvements, and measure performance again.
As AI deployments become larger and more complex, this connection between observability and infrastructure planning becomes increasingly important.
Conclusion
AI Observability is becoming an essential capability for organizations running LLM applications in production. Traditional monitoring alone cannot explain many of the performance, quality, and cost problems that occur in modern AI workloads.
Teams need visibility into TTFT, inter-token latency, token consumption, GPU utilization, GPU memory, queue depth, concurrency, model versions, retrieval performance, and response quality.
The most effective approach is to connect these signals rather than monitor them independently.
When AI Observability is combined with workload-aware infrastructure planning, organizations can identify bottlenecks faster, improve LLM performance, control costs, and build more reliable AI systems.
With platforms such as infratailors.ai, organizations can take the next step by using workload and performance insights to make smarter AI infrastructure decisions.